Why we're mapping T&C

An important part of the FABRIX project involves mapping the textile and clothing sector in the built environment of the pilot cities, Athens and Rotterdam. This spatial analysis helps us to understand the way that the urban environment affects industry and can be optimized to encourage a more collaborative, circular and beautiful version of it. In our case, of course, we’re focusing on circularised supply chains in the T&C industry. We are sharing some very preliminary results here, in advance of the expected deliverable.
Using a combination of RStudio and QGIS, we mapped the businesses active in the Rotterdam region and repeated the same process for Athens. Our goal was to highlight the hotspots in where (circular) textile activities take place, and where these can potentially be further facilitated, based on the business retention of different neighbourhoods.
By marking the changes in spatial distribution of value chain actors on the maps of both cities, we can more accurately pinpoint the opportunities and barriers supply chain actors face in their business collaborations across the cities. This will allow us to determine the conditions they need to develop their activities towards co-created circularity.
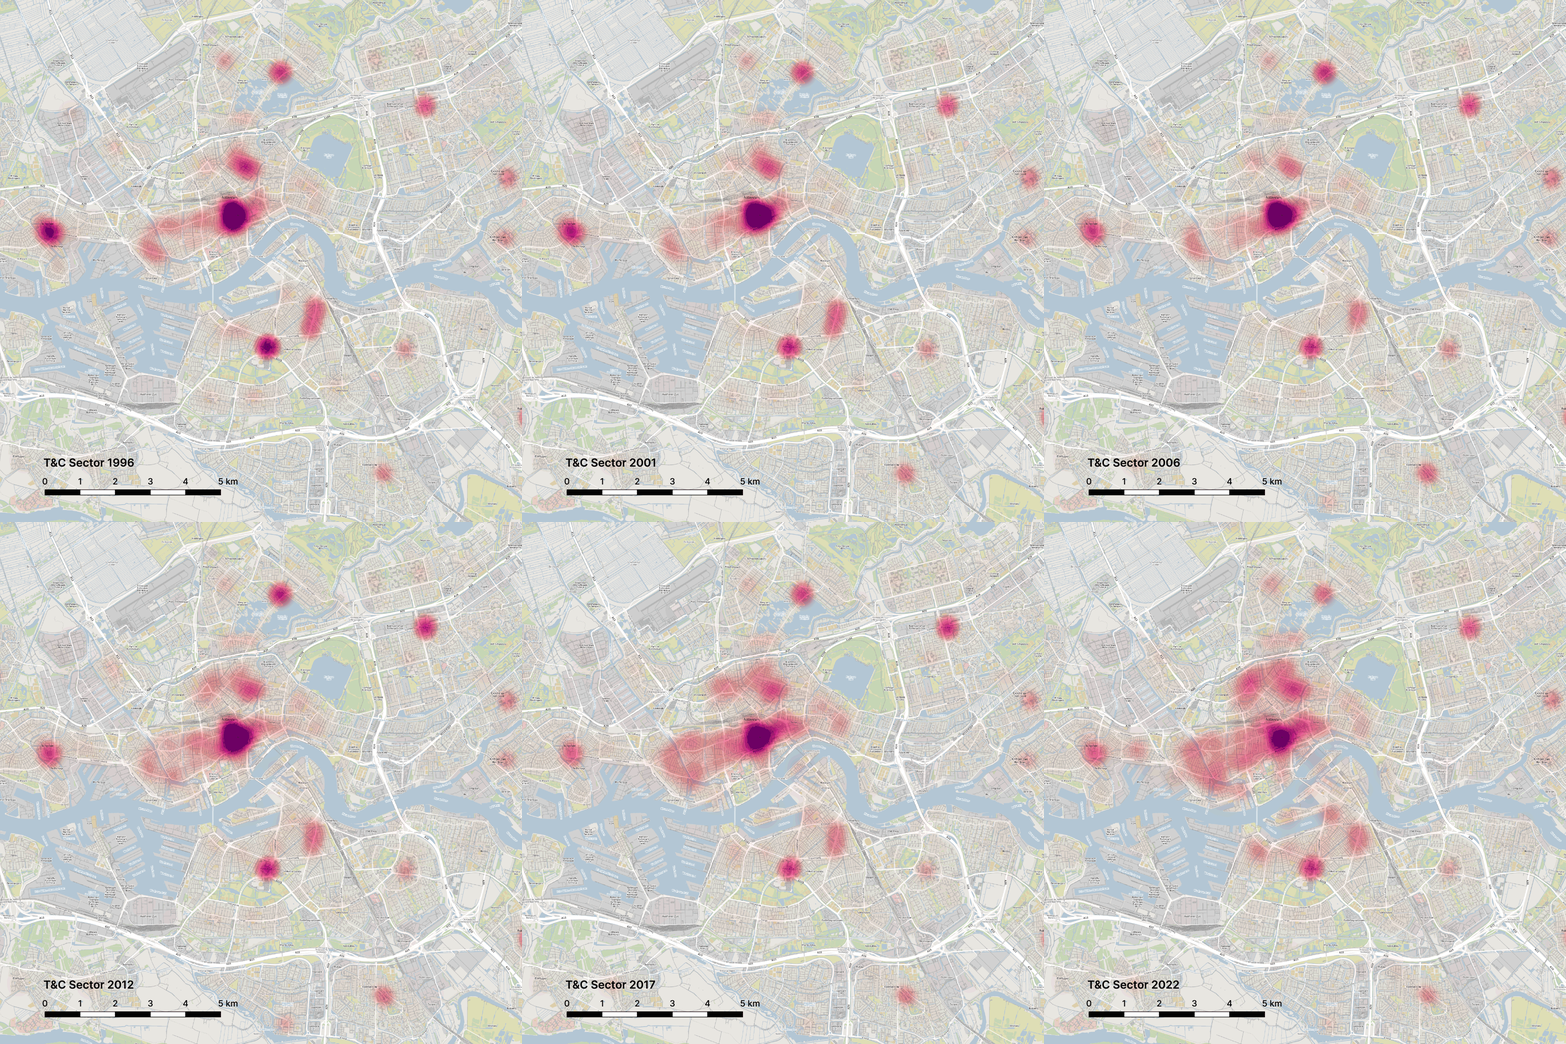
T&C sector in Rotterdam through time
The spatial analysis allows us to observe changes in the locations in which textile activities take place. In the map above, which shows the T&C sector in Rotterdam through time, we can see how the sector has evolved around the city and where the main sectoral locations are. We also see which areas are the densest cores across the years, i.e. which ones are the strongest, surviving the multiple waves that affected the sector in other locations around the city. This may point towards spatially embedded determinants that support these business’ resilience.
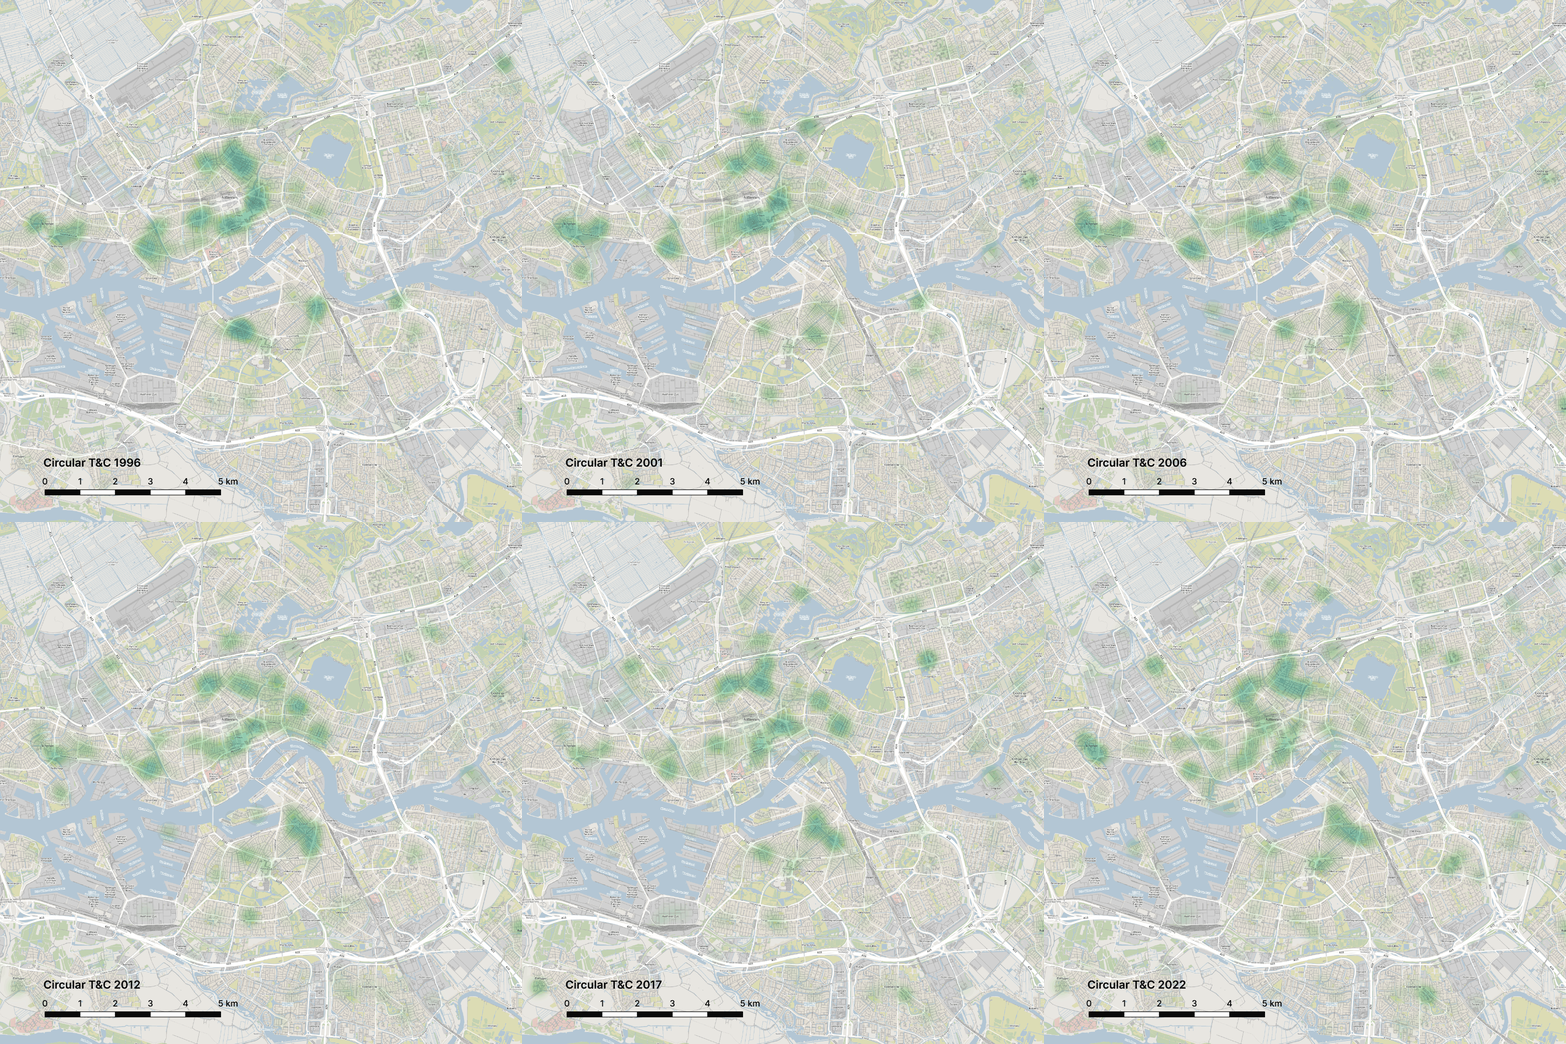
Circular fashion around Rotterdam

The gif above shows the prominence of circular fashion around Rotterdam, through which we can observe which areas are dominant between 1996 and 2022. The circular textile and clothing clusters in and around Rotterdam seem to be “jumping around” the city but they stay mostly stable in and around the shopping centre, around small businesses in the northern neighbourhoods, and in the industrial neighbourhoods in the south.
We look forward to further dissecting these findings and comparing them to the T&C sector mapping in Athens in the upcoming stages of FABRIX.
Contributed by: Minalies Rezikalla, PhD candidate, TU Delft